Hiding users from the Global Address List (GAL) is a fairly straight forward when the user is a cloud account. Simply “Hide from address list” from the Exchange Online console or run some quick powershell:
$LiveCred = Get-Credential
$Session = New-PSSession -ConfigurationName Microsoft.Exchange -ConnectionUri https://ps.outlook.com/powershell/ -Credential $LiveCred -Authentication Basic -AllowRedirection
Import-PSSession $Session
Set-Mailbox -Identity [email protected] -HiddenFromAddressListsEnabled $true
Hiding users from the GAL is fairly straight forward when the user is synchronized from on-premises as well. Simply edit the attribute of the user object, set msExchHideFromAddressLists to True, and do a sync. The problem though is what happens if you don’t have the msExchHideFromAddressLists attribute in Active Directory?
Well, you can either extend your Active Directory Schema for Exchange, which is not something that you can easily roll back if something goes wrong and arguably adds a ton of attributes that likely will be never used. Or, you can simply create a custom sync rule within Azure AD Connect that flows the value from a different attribute.
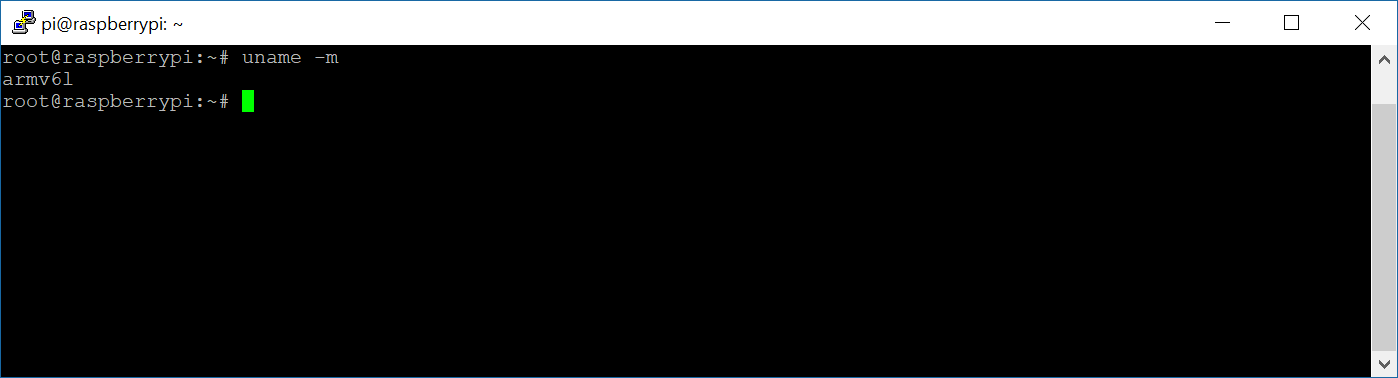
This article will go over how to sync a custom attribute from on-premises to Azure AD to hide a user from the GAL, without the need of extending your Active Directory schema. In this case, we are going to use an attribute called msDS-cloudExtensionAttributeX (where X is the number of the attribute that is free/not being used within your directory). The msDS-cloudExtensionAttribute(s) were introduced in Windows Server 2012 and has 20 different numbers to allow flexibility for these types of scenarios. Now some customers may gravitate towards using a different attribute like showInAddressBook. The problem with the showInAddressBook is this attribute is referenced by very old versions of Exchange (which I’m sure people would never be running 😉 ) and is looking for the format of the common name of an object (not what we want). In this case, easiest way to move forward is to simply use the msDS-cloudExtensionAttributes.
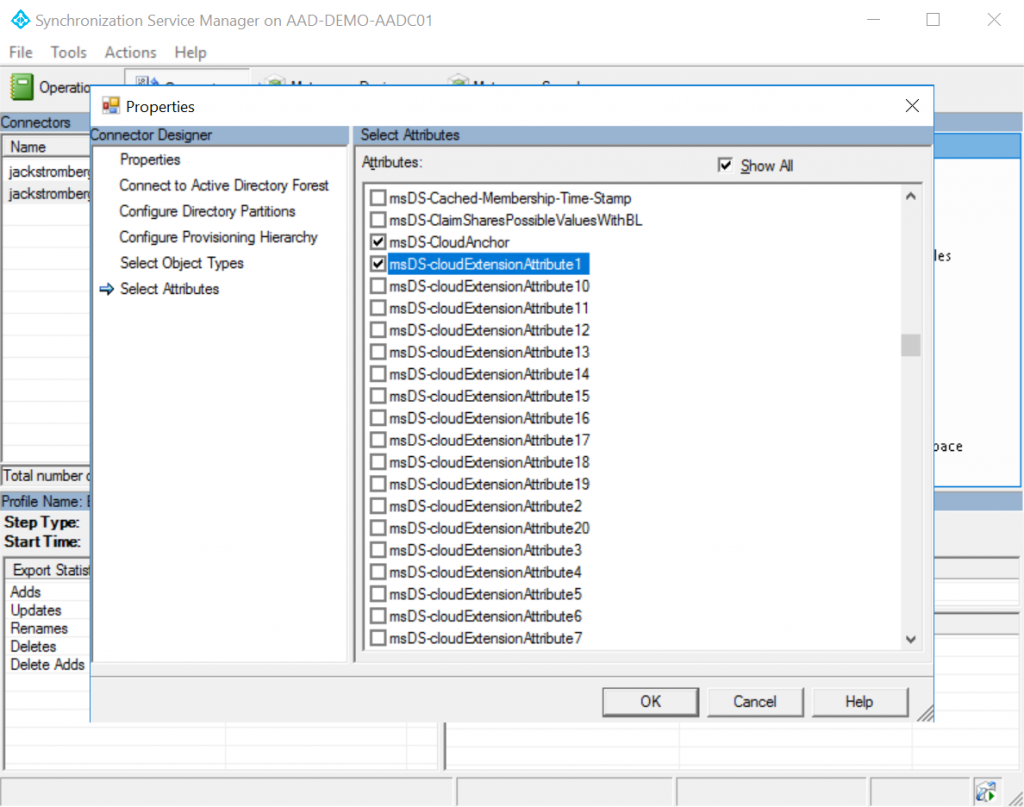
Step 1: Scope in the msDS-cloudExtensionAttribute for Azure AD Connect
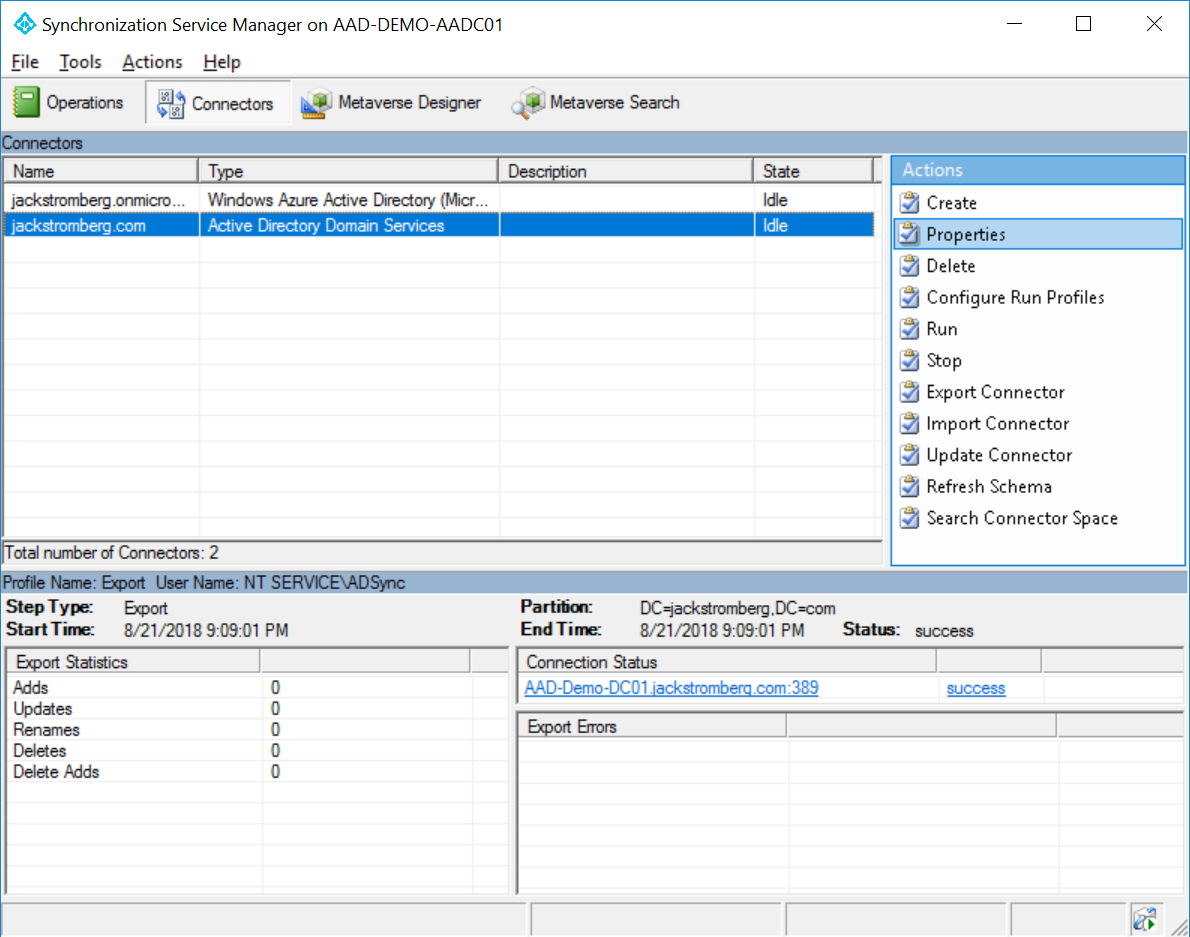
Open the Azure AD Connect Synchronization Service

Navigate to the Connectors tab, select your Active Directory (not the domain.onmicrosoft.com entry), and select Properties

In the top right, click on Show All, scroll down and find msDS-CloudExtensionAttribute1 (you can use any of the numbers 1-20, just make sure to check the box you are using), and select OK
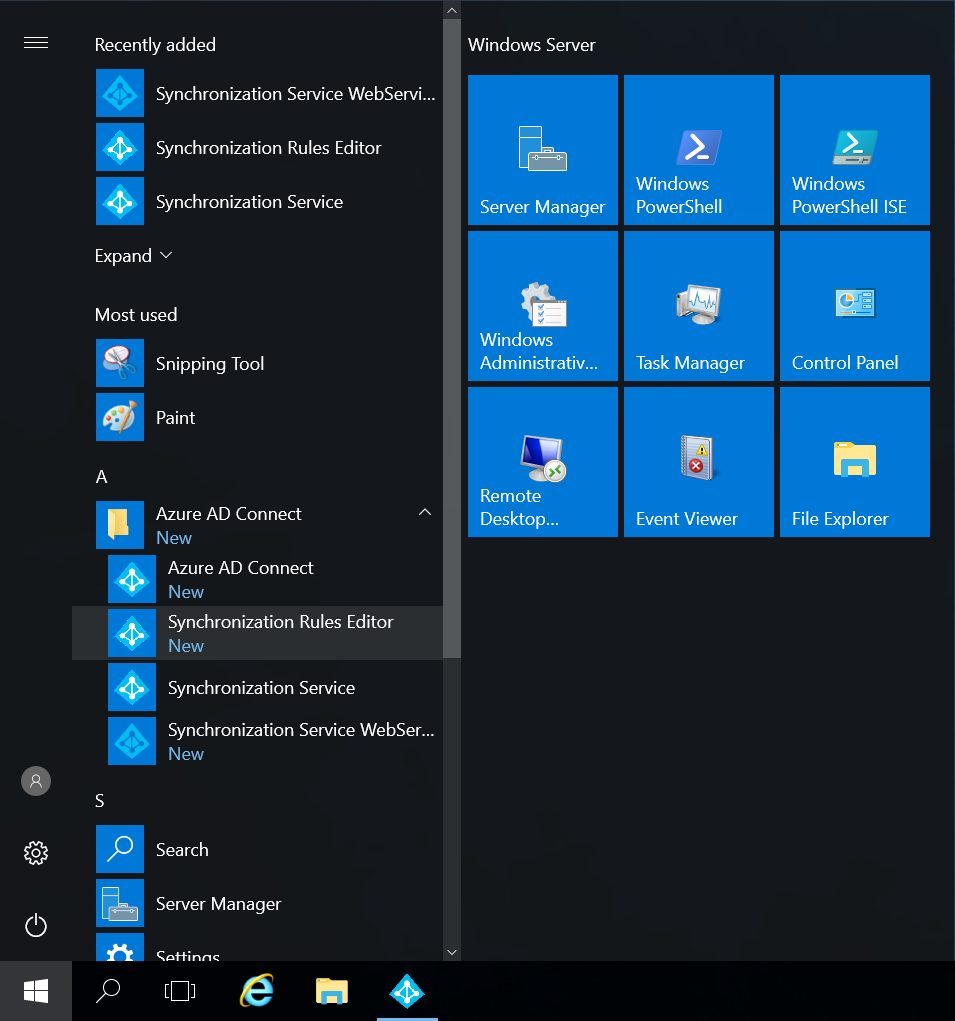
Step 2: Create a custom sync rule
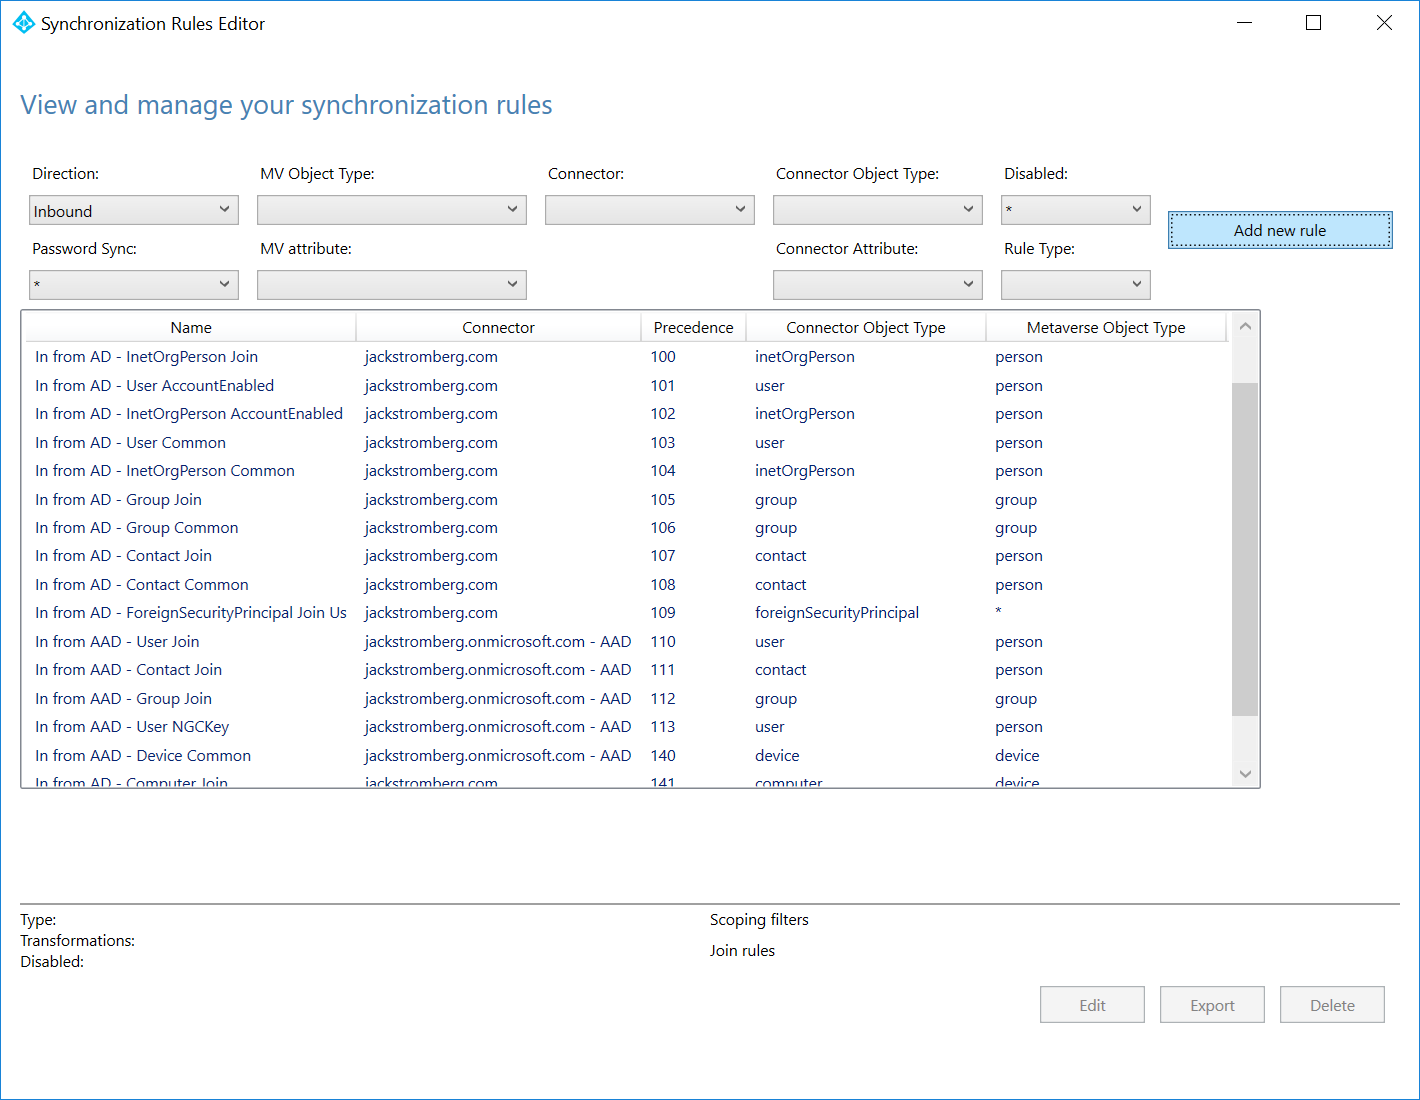
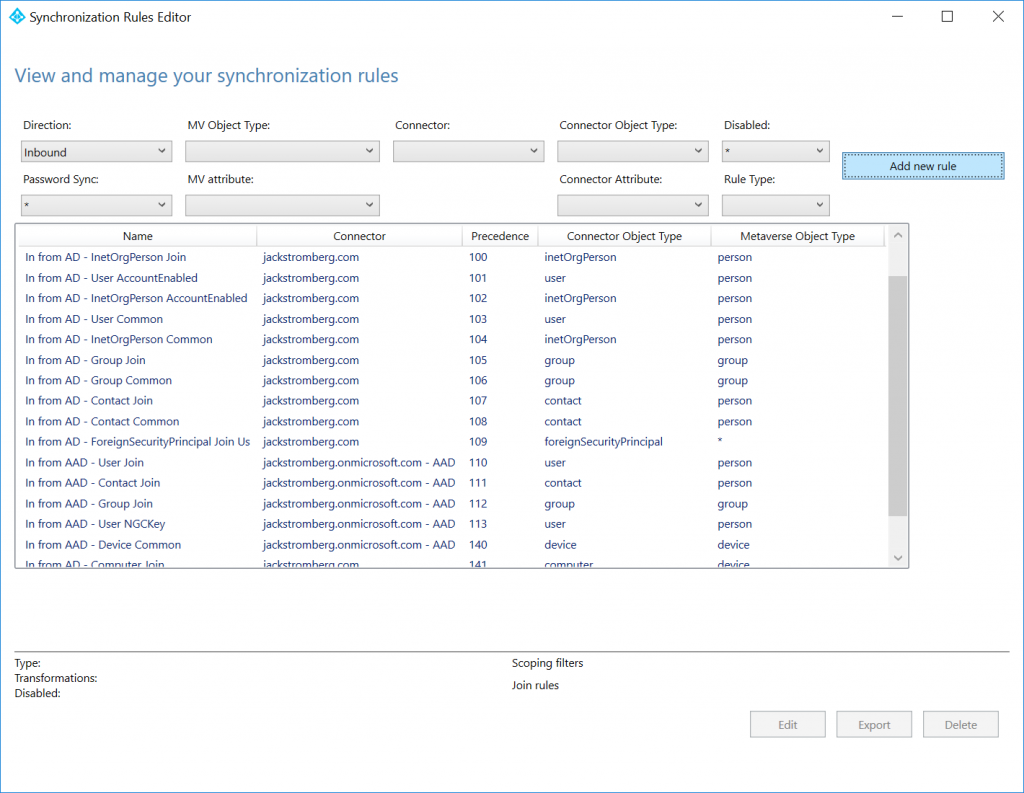
Open up the Azure AD Connect Synchronization Rules Editor
Click on the Add new rule button (make sure direction in the top left shows Inbound)
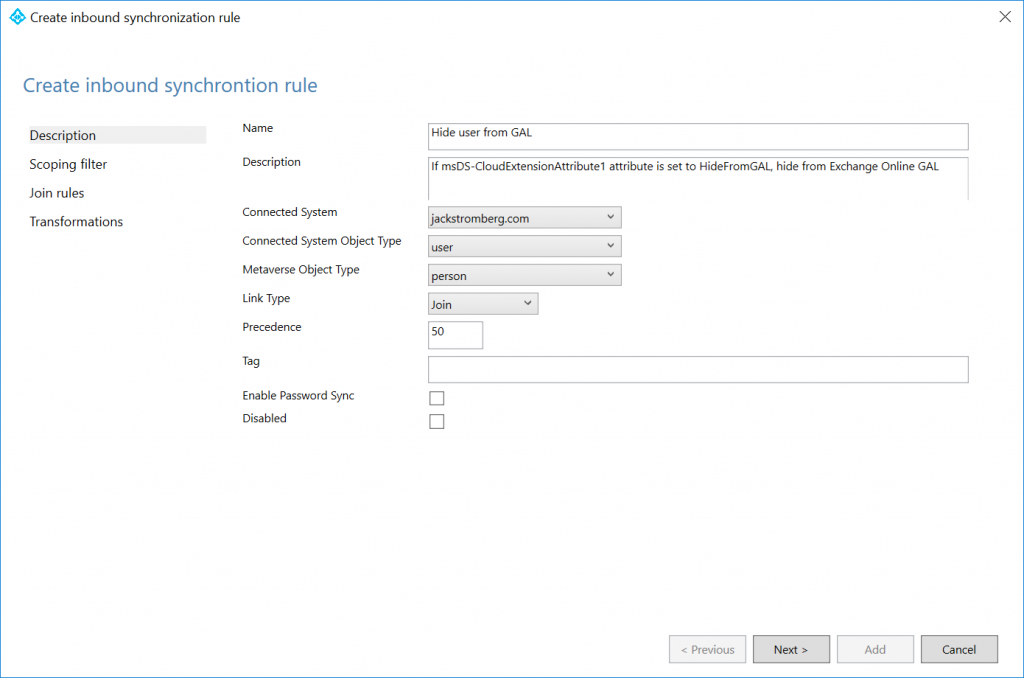
Enter the following for the description:
Name: Hide user from GAL
Description: If msDS-CloudExtensionAttribute1 attribute is set to HideFromGAL, hide from Exchange Online GAL
Connected System: Your Active Directory Domain Name
Connected System Object Type: user
Metaverse Object Type: person
Link Type: Join
Precedence: 50 (this can be any number less than 100. Just make sure you don’t duplicate numbers if you have other custom rules or you’ll receive a dead-lock error from SQL Server)
Click Next > on Scoping filter and Join rules, those can remain blank
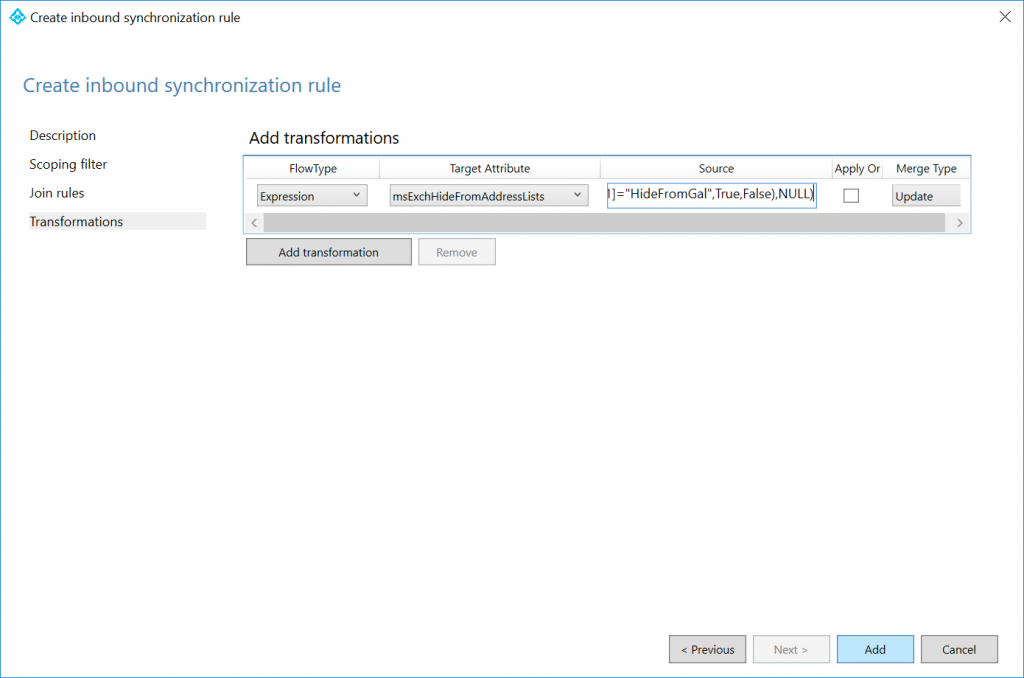
Enter the following Transformation page, click the Add transformation button, fill out the form with the values below, and then click Add
FlowType: Expression
Target Attribute: msExchHideFromAddressLists
Source:
IIF(IsPresent([msDS-cloudExtensionAttribute1]),IIF([msDS-cloudExtensionAttribute1]="HideFromGAL",True,False),NULL)
Step 3: Perform an initial sync
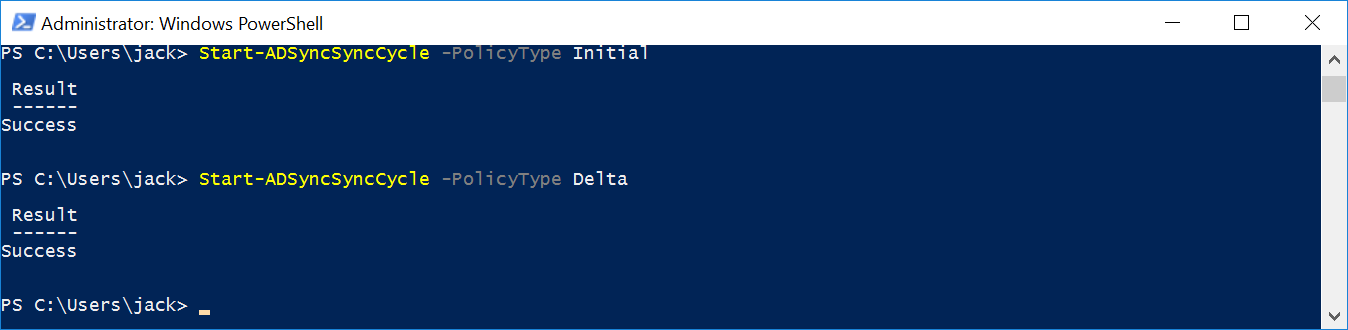
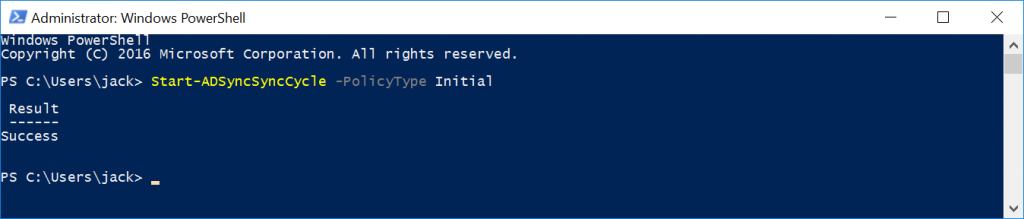
Open up Windows PowerShell on the Azure AD Connect Server
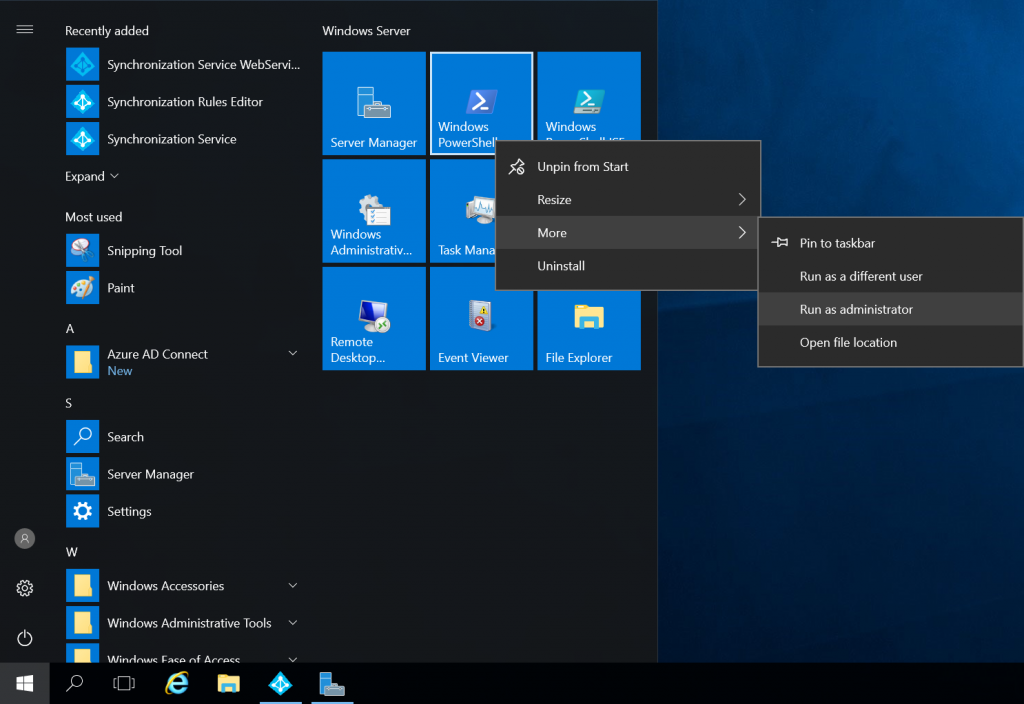
Execute the following command: Start-ADSyncSyncCycle -PolicyType Initial
Step 4: Hide a user from Active Directory
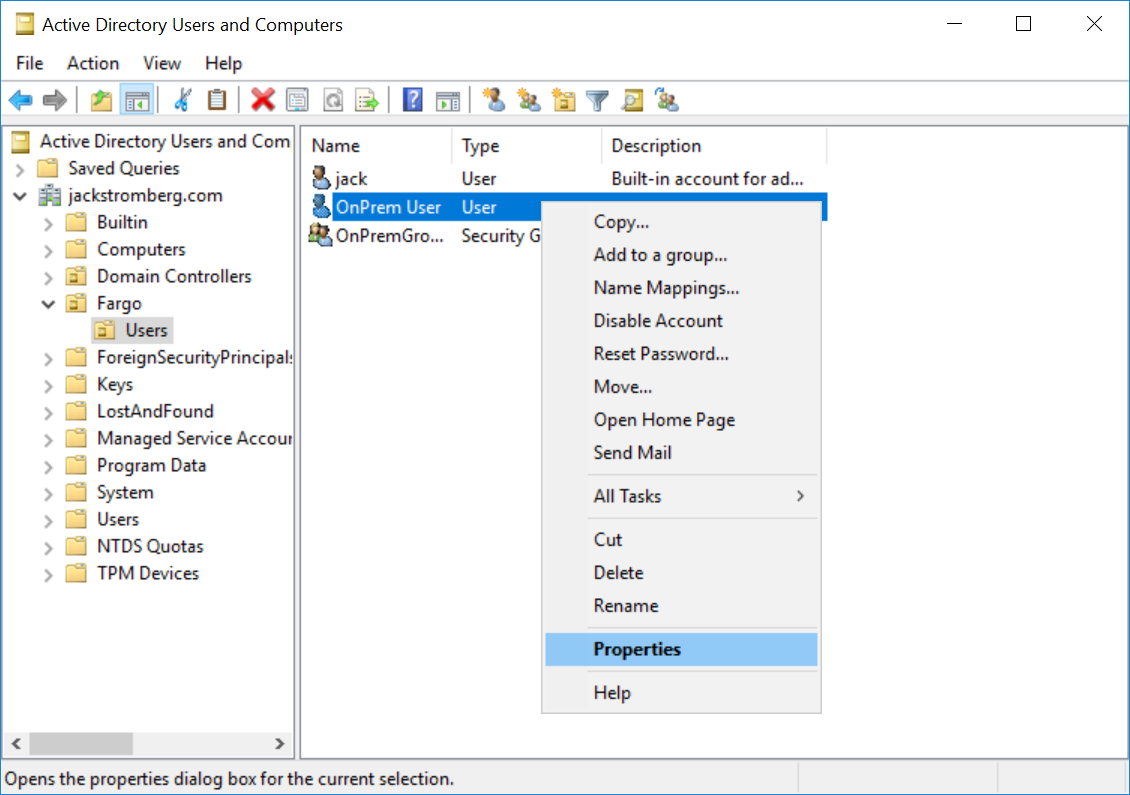
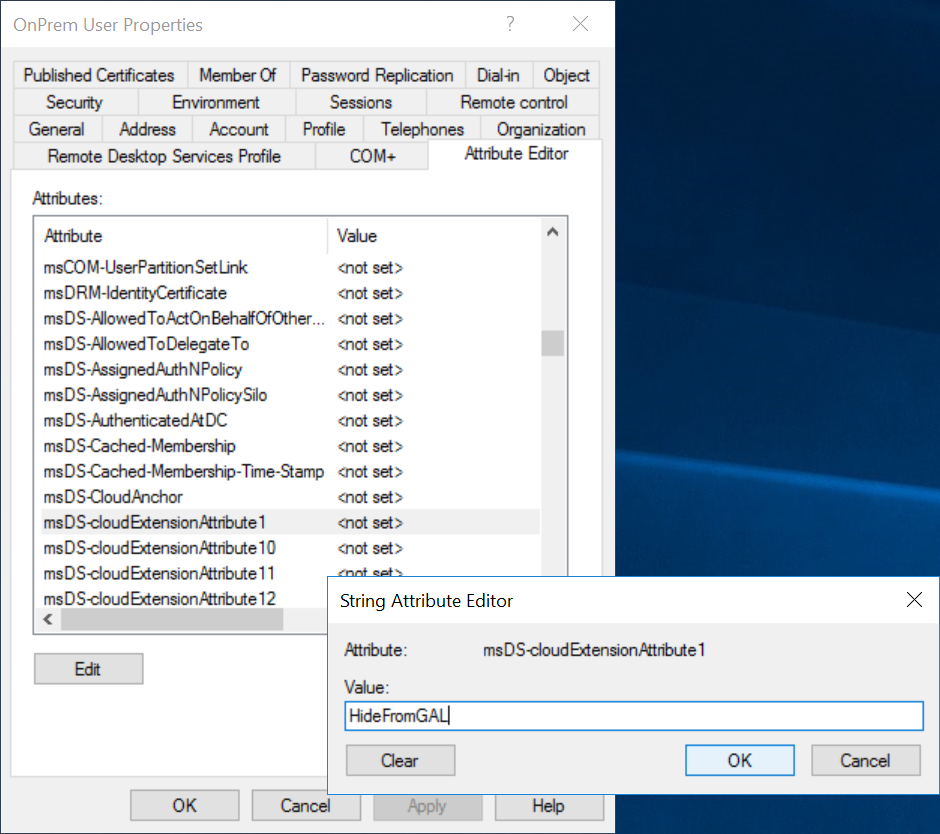
Open Active Directory Users and Computers, find the user you want to hide from the GAL, right click select Properties

Select the Attributes Editor tab, find msDS-cloudExtensionAttribute1, and enter the value HideFromGAL (note, this is case sensitive), click OK and OK to close out of the editor.
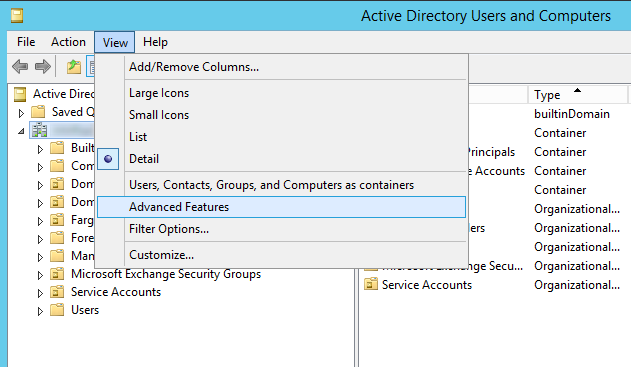
Note: if you don’t see the Attribute Editor tab in the previous step, within Active Directory Users and Computers, click on View in the top menu and select Advanced Features
Step 5: Validation
Open the Azure AD Connect Synchronization Service
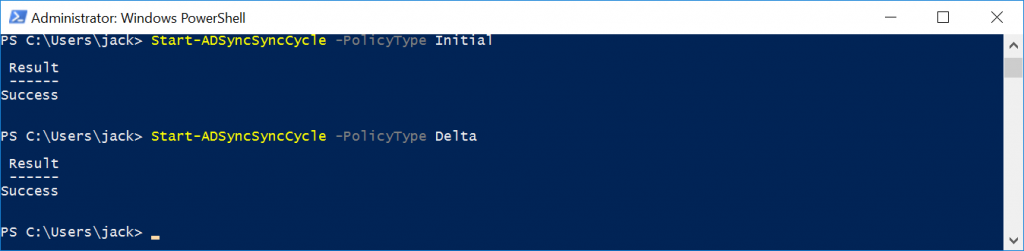
On the Operations tab, if you haven’t seen a Delta Synchronization, manually trigger the Delta sync to pick up the change you made in Active Directory
Select the Export for the domain.onmicrosoft.com connecter and you should see 1 Updates
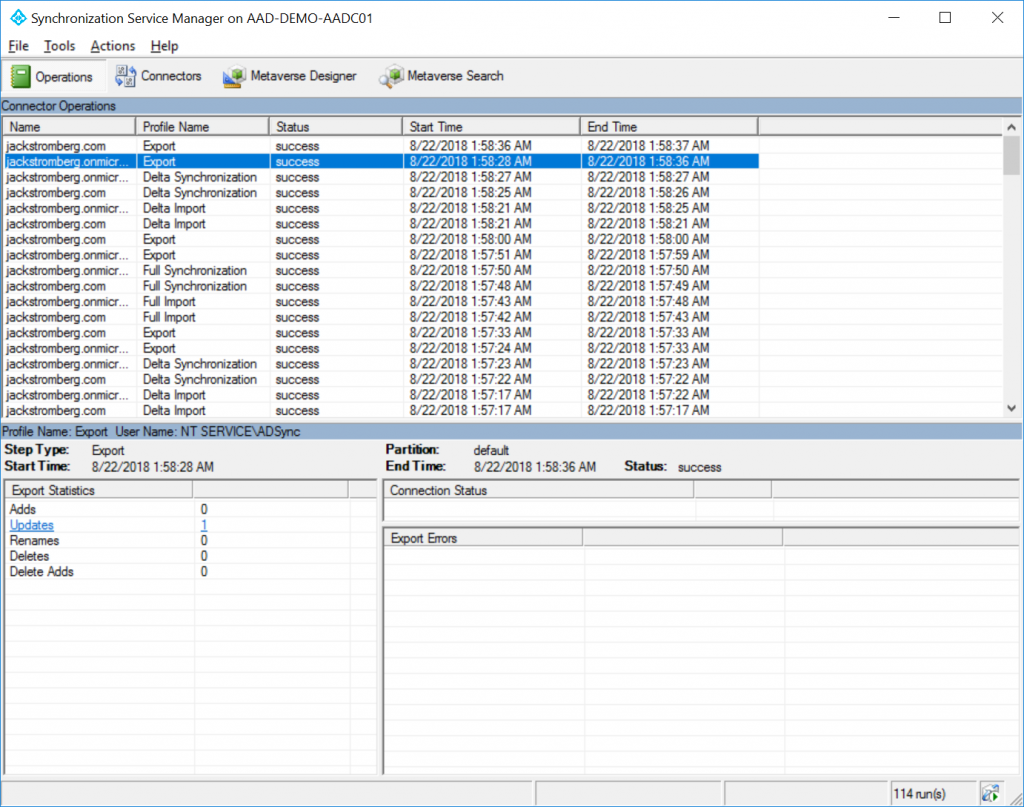
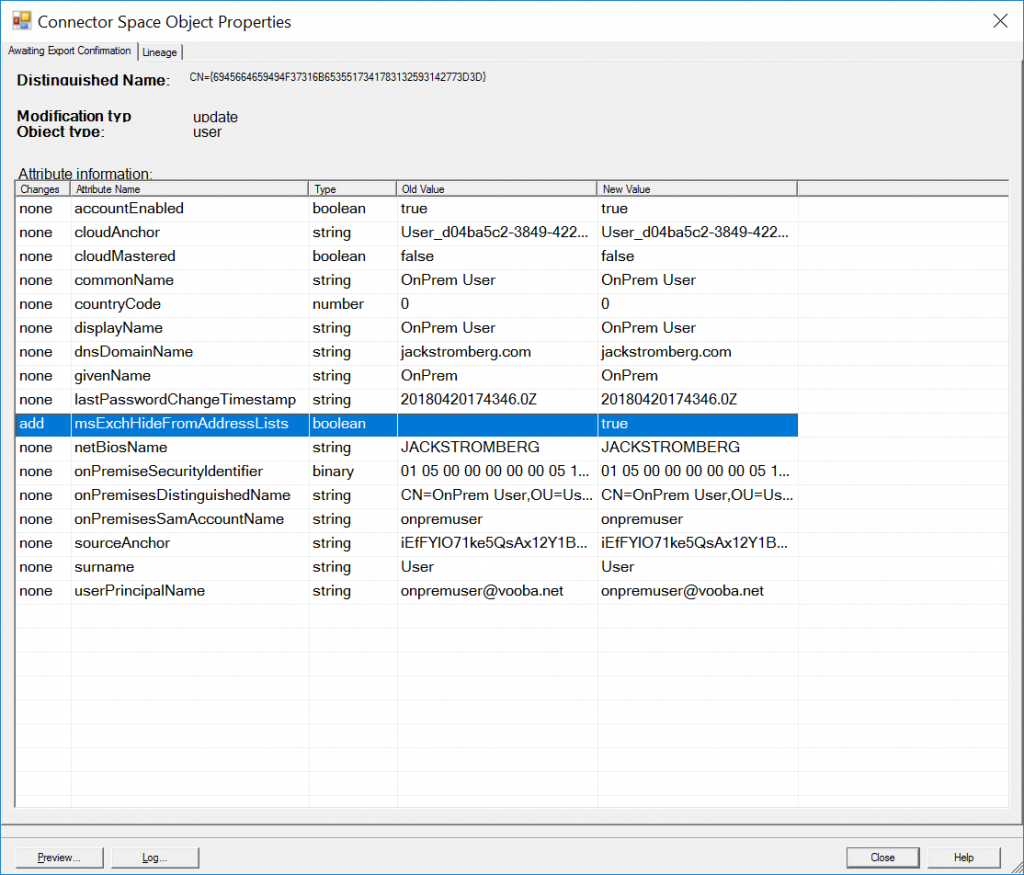
Select the user account that is listed and click Properties. On the Connector Space Object Properties, you should see Azure AD Connect triggered an add to Azure AD to set msExchHideFromAddressLists set to true
There ya have it! An easy way to hide users from the GAL with minimal risk to ongoing operations. Due to the way Azure AD Connect upgrades, our sync rule will persist fine during regular updates/patches released.